20CR3 validation scatterplot February 1953
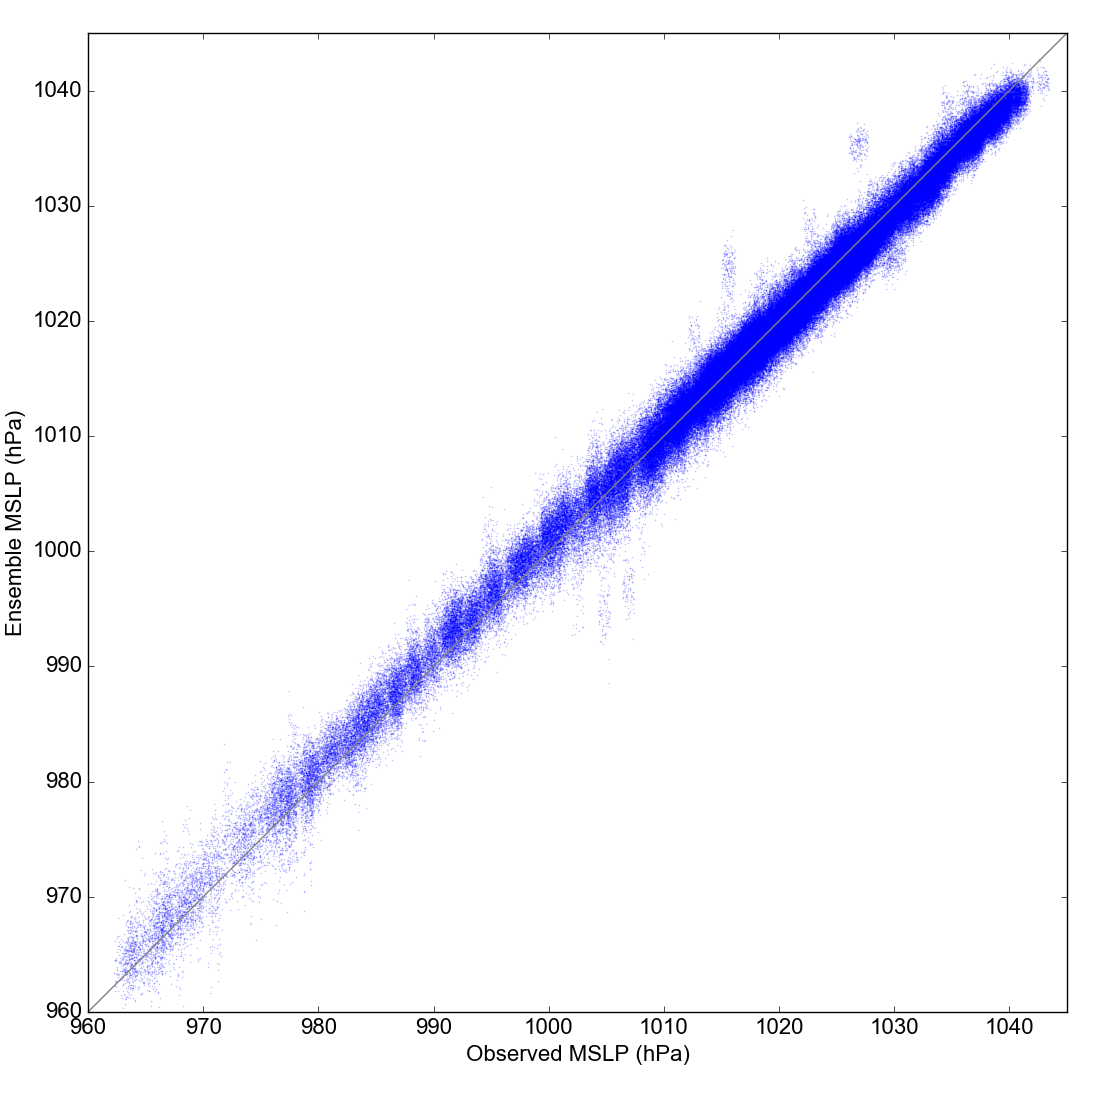
Scatterplot of observed v. reanalysis MSLP
Download the data (uses this script)
#!/bin/sh
../../../scripts/get_data.py --reanalysis=20cr3 --start="1953020118" --end="1953022818"
Extract the reanalysis data associated with each observation (uses this script)
../../../scripts/get_comparison.py --start="1953020118" --end="1953022818" --skip=LERWICK --skip=STORNOWAY --skip=VALENTIA --skip=CULDROSE --skip=GORLESTON --skip=LEUCHARS --reanalysis=20cr3 --npar=6
Make the figure (uses this script)
../../../scripts/scatter.py --start="1953020118" --end="1953022818" --reanalysis=20cr3
