PRATE ensemble stripes by latitude
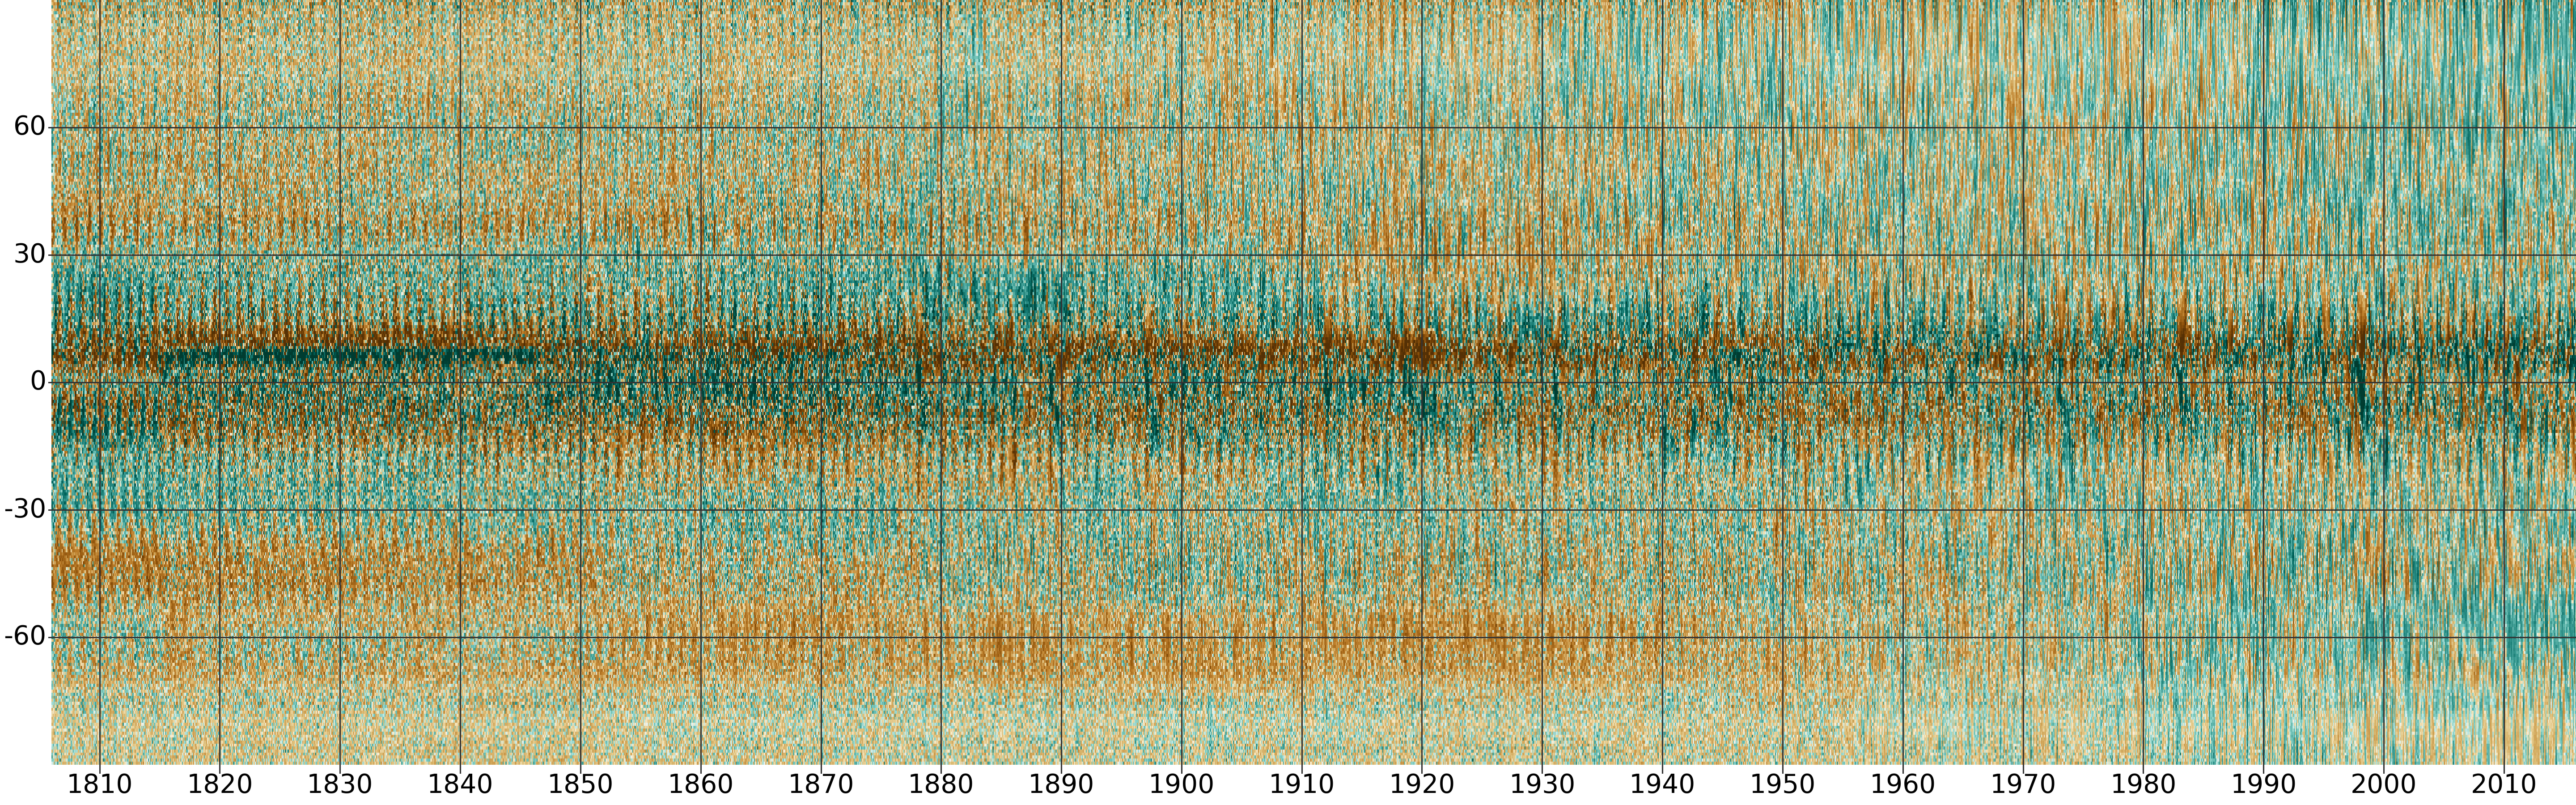
Monthly precipitation rate anomalies (w.r.t. 1961-90) from the 20CRv3 ensemble. The vertical axis is latitude, and each pixel is a longitudinal mean from a randomly selected ensemble member.
Sampling randomly from the ensemble means that regions where the variance across the ensemble is larger than the ensemble mean appear speckled. This provides an indication of uncertainty.
