TMP2m ensemble stripes by latitude
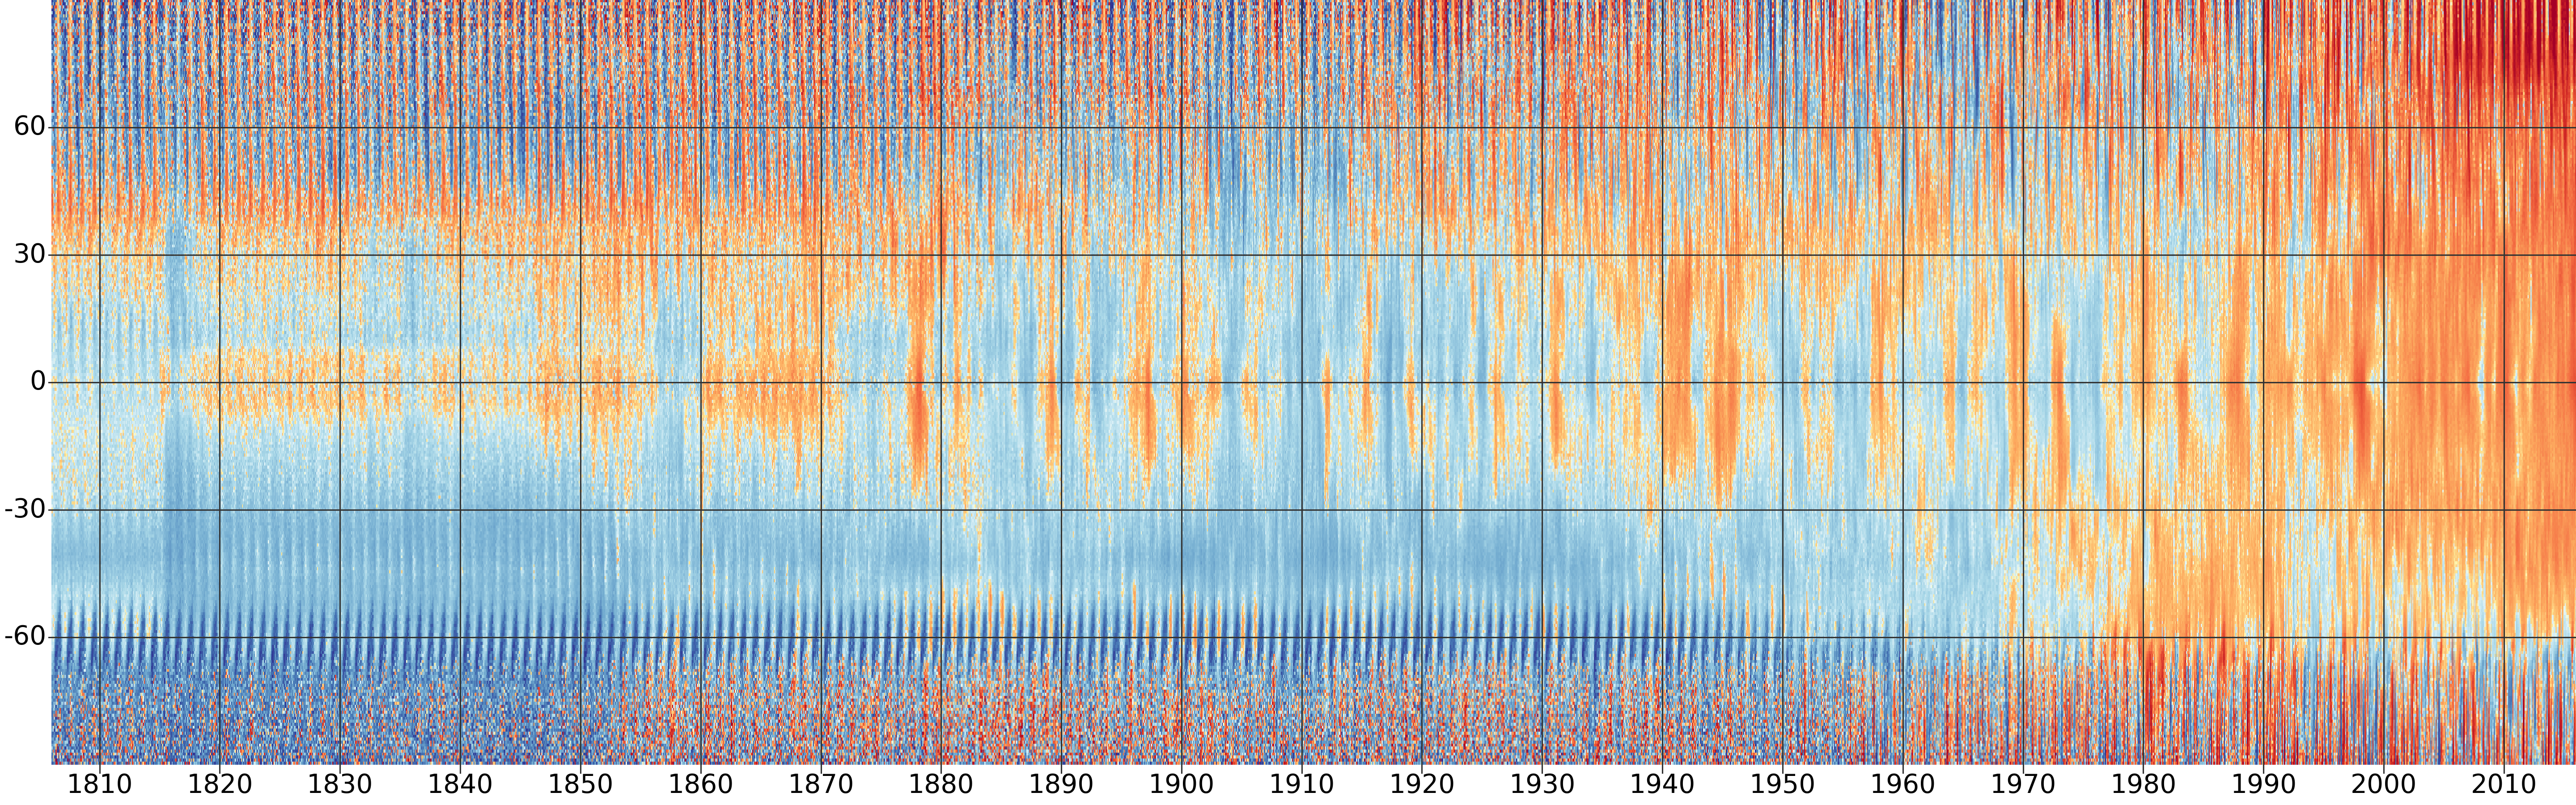
Monthly 2m-temperature anomalies (w.r.t. 1961-90) from the 20CRv3 ensemble. The vertical axis is latitude, and each pixel is a longitudinal mean from a randomly selected ensemble member.
Sampling randomly from the ensemble means that regions where the variance across the ensemble is larger than the ensemble mean appear speckled. This provides an indication of uncertainty.
This figure shows:
A clear global warming signal.
The increasing confidence in the reanalysis as the observation density improves (reduction in speckling - particularly clear in the high latitudes).
That we need HadISST: Before 1871, the SSTs used in 20CR were generated by starting from a climatology and iterating between the atmosphere model in 20CR and the ocean model in SODAsi - each constrained by the (few) available observations. This has not worked very well.
The impact of volcanic eruptions (Tambora in 1816 shows up very nicely).
A large cooling in the southern ocean in winter prior to about 1960. This is an effect of the increased sea-ice cover in HadISST in the earlier periods, which allows a large fall in the air temperature over the ice-covered regions. This looks odd, but we can’t say it did not happen - there are no observations.
A marked cooling in Antarctica before 1853.
