See also
Full ensemble by latitude
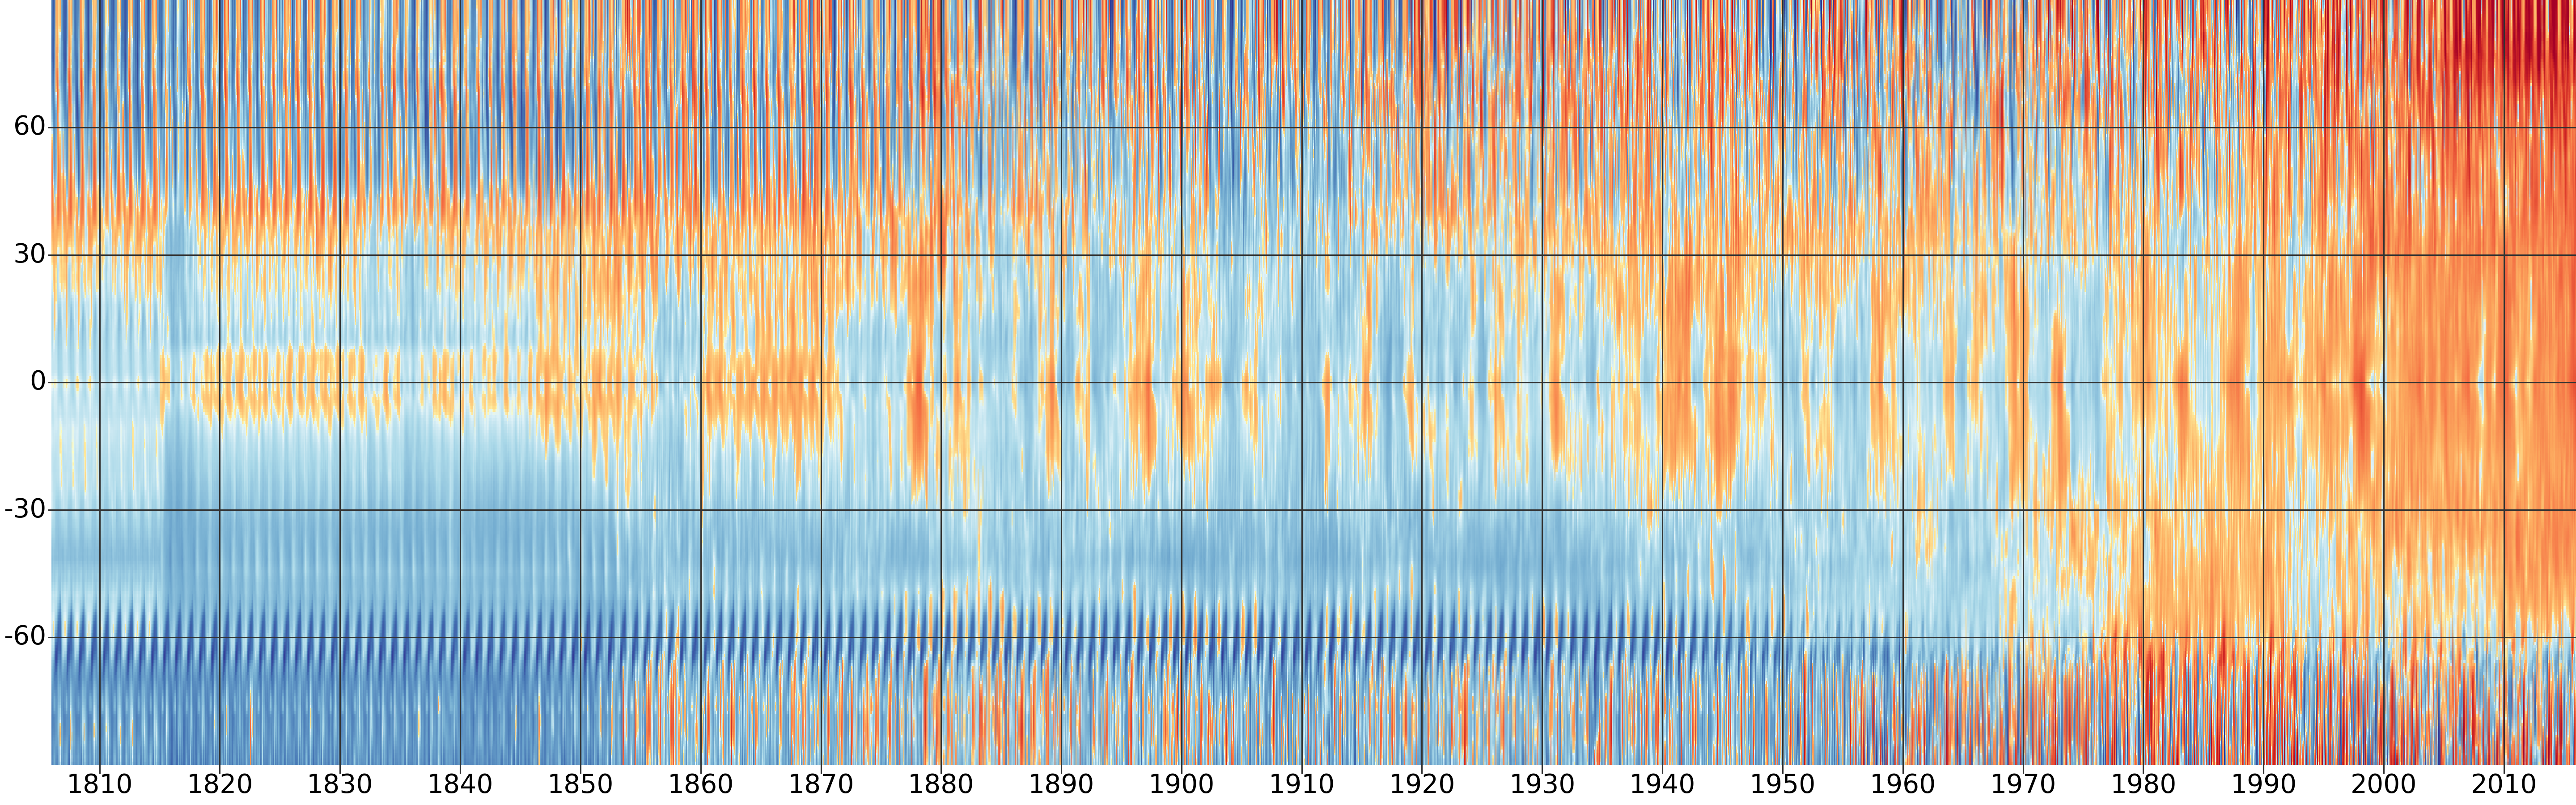
Full ensemble by longitude
Single member by latitude
Monthly 2m-temperature anomalies (w.r.t. 1961-90) from the 20CRv3 ensemble. The vertical axis is longitude, and each pixel is an area-weighted latitudinal mean from the ensemble mean.