20CR3 validation Spread v. Error plot February 1953
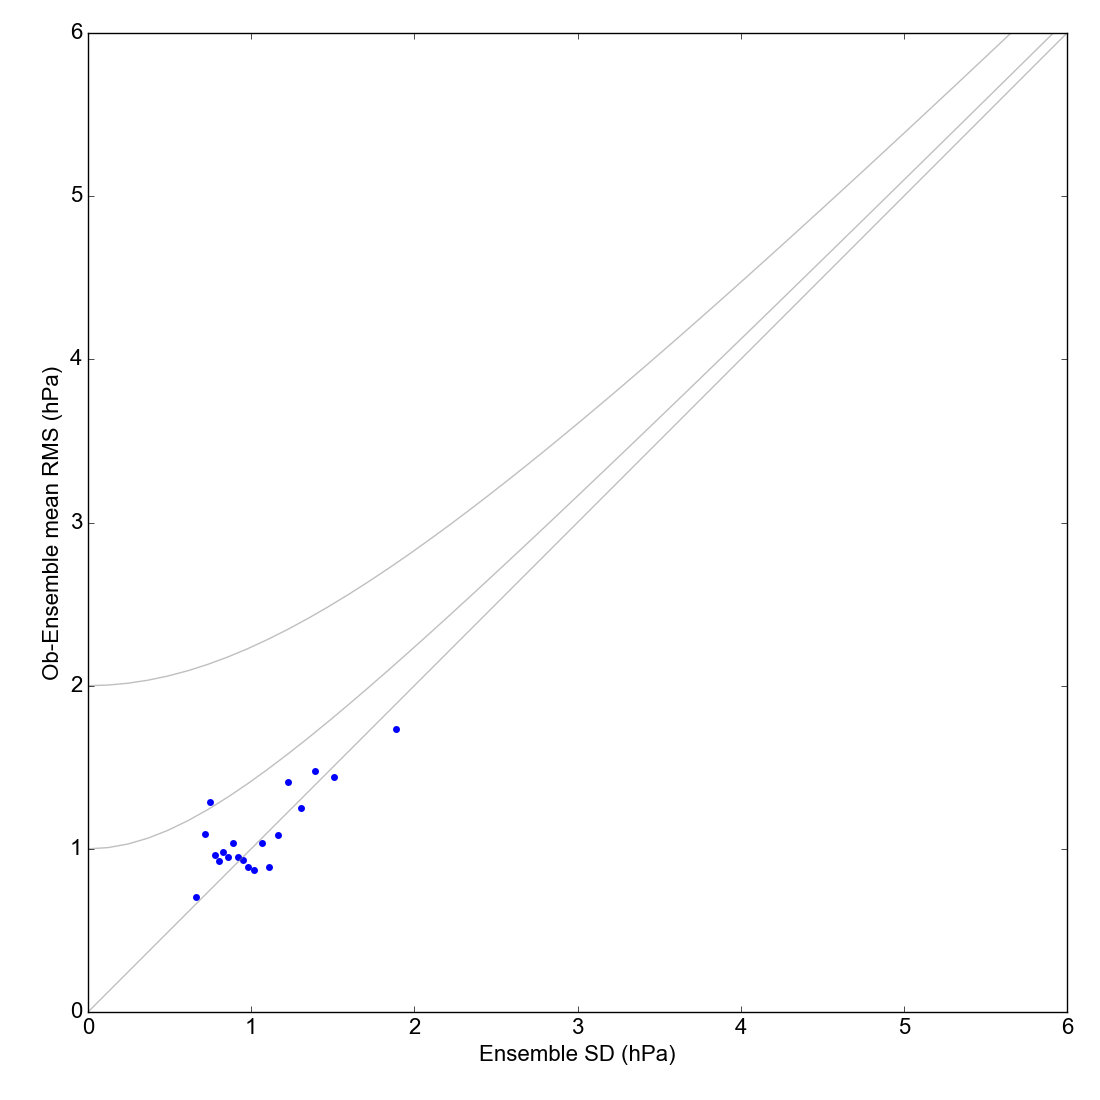
RMS reanalysis difference from observations, against reanalysis spread.
If the observations were perfect, and the reanalysis spread was an unbiased estimate of its error, the RMS difference and the spread would be the same at all points. Because the observations have error, the RMS difference should be bigger than the spread, especially at small spread: the three grey lines show the expected relationship for three values of observation error (0, 1 and 2hPa). If the points are above the lines, the reanalysis is overconfident (spread too small) - if they are below the lines it is underconfident (spread too large).
Download the data (uses this script)
#!/bin/sh
../../../scripts/get_data.py --reanalysis=20cr3 --start="1953020118" --end="1953022818"
Extract the reanalysis data associated with each observation (uses this script)
../../../scripts/get_comparison.py --start="1953020118" --end="1953022818" --skip=LERWICK --skip=STORNOWAY --skip=VALENTIA --skip=CULDROSE --skip=GORLESTON --skip=LEUCHARS --reanalysis=20cr3 --npar=6
Make the figure (uses this script)
../../../scripts/rms_v_rms.py --start="1953020118" --end="1953022818" --reanalysis=20cr3 --nbins=20
