20CR3 validation scatterplot January 1872
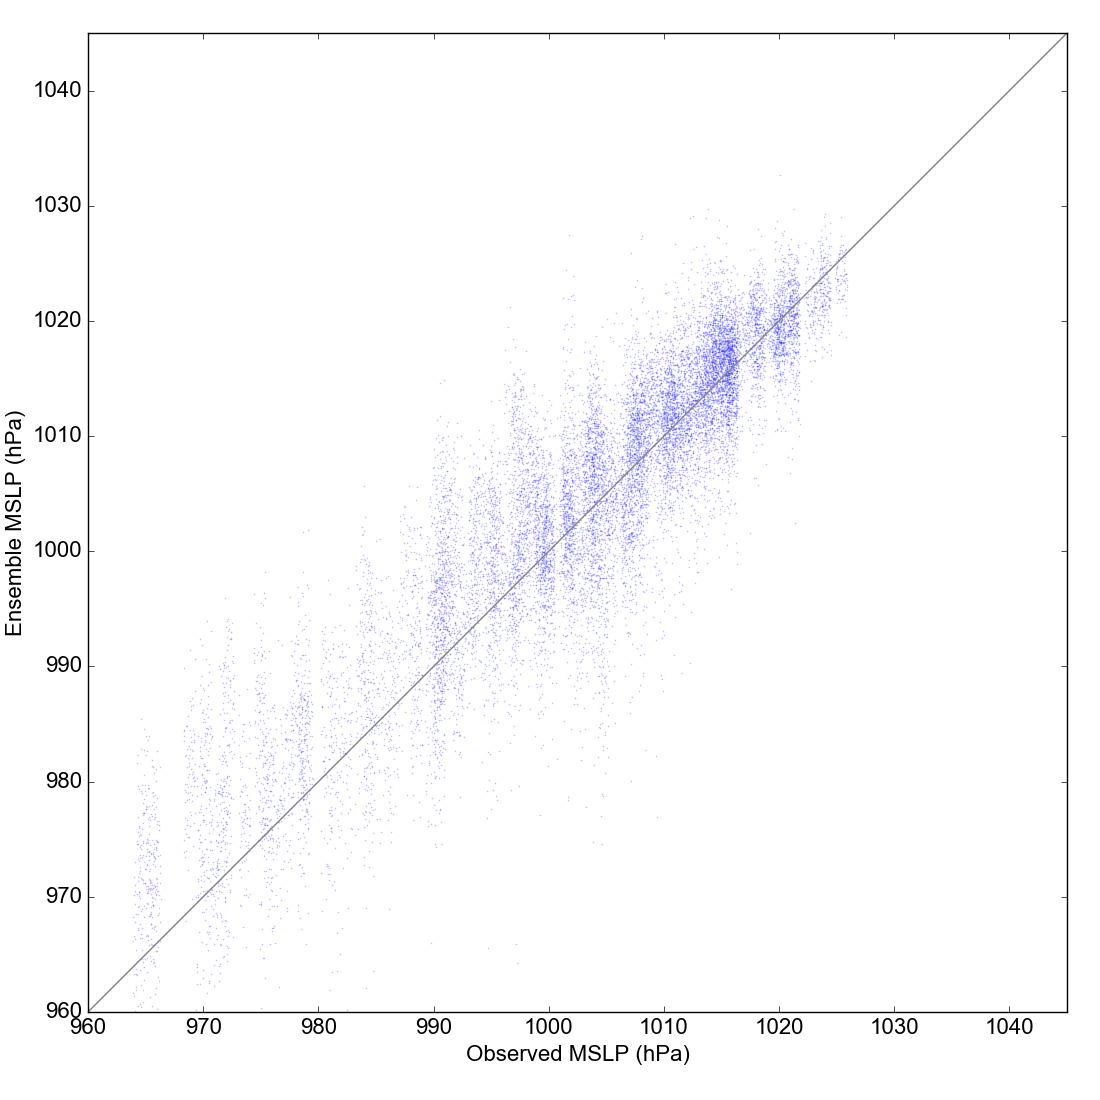
Scatterplot of observed v. reanalysis MSLP
Download the data (uses this script)
#!/bin/sh
../../../scripts/get_data.py --reanalysis=20cr3 --start="1872010118" --end="1872013118"
Extract the reanalysis data associated with each observation (uses this script)
../../../scripts/get_comparison.py --start="1872010118" --end="1872013118" --skip=ABERDEEN --skip=LISBON --skip=ROCHEFORT --skip=DIYARBAKIR --skip=BAGHDAD --skip=BASRA --reanalysis=20cr3 --npar=6
Make the figure (uses this script)
../../../scripts/scatter.py --start="1872010118" --end="1872013118" --reanalysis=20cr3
