# (C) British Crown Copyright 2017, Met Office
#
# This code is free software: you can redistribute it and/or modify it under
# the terms of the GNU Lesser General Public License as published by the
# Free Software Foundation, either version 3 of the License, or
# (at your option) any later version.
#
# This code is distributed in the hope that it will be useful,
# but WITHOUT ANY WARRANTY; without even the implied warranty of
# MERCHANTABILITY or FITNESS FOR A PARTICULAR PURPOSE.  See the
# GNU Lesser General Public License for more details.
#

# Combination scatter+contour plot

import iris
import DWR
import numpy
import collections
import matplotlib
from matplotlib.patches import Circle
import cartopy
import cartopy.crs as ccrs
import Meteorographica as mg

from .scatter import plot_scatter
from .contour import plot_contour

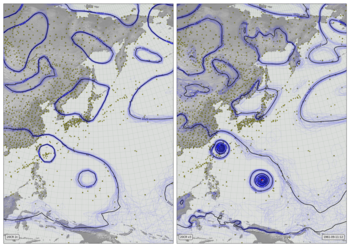
[docs]def plot_scatter_contour(fig,field,obs_r,dwr_obs,dte,**kwargs):
    """Make a combined contour-plot and scatter plot

    Args:
        fig (:`matplotlib.figure`): Figure to hold the plot
        field (:obj:`iris.Cube.cube`): Reanalysis mslp ensemble
        obs_r (:obj:`pandas.DataFrame`): Reanalysis observations.
        dwr_obs (:obj:`pandas.DataFrame`): DWR observations.
        dte (:obj:`datetime.datetime`): Time of data to plot

    Kwargs:
        projection (:obj:`cartopy.crs`): Map projection to use, default UKV.
        scale (:obj:`float`): Map scale - latitude range, default 20.
        pressure_range (:obj:`list`): (min,max) pressure for scatterplot, default [945,1045].
        obs_radius (:obj:`float`): Reanalysis obs plot size, default 0.15.
        contour_levels (:obj:`list`): Values to plot contours at, default numpy.arange(870,1050,10).
        contour_width (:obj:`float`): Width of member contour lines, default 0.1.
        contour_mask (:obj:`float`): Plot mean contours where spread < this, default 3.
        n_contours (:obj:`int`): Max. number of member contour to plot, default None - all members.
        dwr_color (:obj:`str`): Either a color name, or the string 'anomaly' (default) to color by pressure anomaly.
        dwr_anomaly_range (:obj:`float`): Anomaly color scale factor, default 20.
        dwr_radius (:obj:`float`): DWR obs plot size, default 0.25.
        xlabel (:obj:`str`): x-axis label for scatter plot, default 'MSLP (hPa)'.
        scatter_point_size (:obj:`float`): Size of ensemble dots in scatter plot (pts), default 25.
        scatter_alpha (:obj:`float`): Alpha transparency of ensemble dots in scatter plot (pts), default 0.5.
        stations (:obj:`list`): Names of DWR stations to plot, if missing, taken from dwr_obs.
        station_latlon (:obj:`dict`): Positions of DWR stations to plot (each station entry a dictionary with 'latitude' and 'longitude'), if missing, taken from dwr_obs.
    |
    """

    # Set keyword argument defaults
    kwargs.setdefault('projection',ccrs.RotatedPole(pole_longitude=177.5,
                                                          pole_latitude=35.5))
    kwargs.setdefault('scale',20.0)
    kwargs.setdefault('stations',list(collections.OrderedDict.fromkeys(
                                 dwr_obs.loc[:,'name']).keys()))
    kwargs.setdefault('stations',list(collections.OrderedDict.fromkeys(
                                      dwr_obs.loc[:,'name']).keys()))
    if 'station_latlon' not in kwargs:
        latlon={}
        for station in kwargs.get('stations'):
           latlon[station]=DWR.get_station_location(dwr_obs,station)
        kwargs['station_latlon']=latlon

    ax_map=fig.add_axes([0.01,0.01,0.485,0.98],
                           projection=kwargs.get('projection'))
    aspect=fig.get_size_inches()[1]/(fig.get_size_inches()[0]/2.0)
    extent=[kwargs.get('scale')*-1,kwargs.get('scale'),
            kwargs.get('scale')*-1*aspect,kwargs.get('scale')*aspect]
    if kwargs.get('stations') is None:
        stations=list(collections.OrderedDict.fromkeys(
                     dwr_obs.loc[:,'name']).keys())

    plot_contour(ax_map,extent,dte,field,obs_r,dwr_obs,**kwargs)

    # Label with the date
    mg.utils.plot_label(ax_map,
                  '%04d-%02d-%02d:%02d' % (dte.year,dte.month,
                                           dte.day,dte.hour),
                  facecolor=fig.get_facecolor(),
                  x_fraction=0.02,
                  horizontalalignment='left')

    ax_scp=fig.add_axes([0.6,0.06,0.39,0.93])

    plot_scatter(ax_scp,field,dwr_obs,dte,**kwargs)

    # Join each station name to its location on the map
    # Need another axes, filling the whole fig
    ax_full=fig.add_axes([0,0,1,1])
    ax_full.patch.set_alpha(0.0)  # Transparent background

    # Map location of a station in ax_full coordinates
    def pos_left(idx):
        station=kwargs.get('stations')[idx]
        latlon=kwargs.get('station_latlon')[station]
        rp=ax_map.projection.transform_points(ccrs.PlateCarree(),
                                  numpy.asarray(latlon['longitude']),
                                  numpy.asarray(latlon['latitude']))
        new_lon=rp[:,0]
        new_lat=rp[:,1]

        result={}
        scale=kwargs.get('scale')
        result['x']=0.01+0.485*((new_lon-(scale*-1))/(scale*2))
        result['y']=0.01+0.98*((new_lat-(scale*aspect*-1))/
                                           (scale*2*aspect))
        return result

    # Label location of a station in ax_full coordinates
    def pos_right(idx):
        result={}
        result['x']=0.51
        result['y']=0.06+(0.93/len(kwargs.get('stations')))*(idx+0.5)
        return result

    for i in range(0,len(kwargs.get('stations'))):
        p_left=pos_left(i)
        p_right=pos_right(i)
        ax_full.add_patch(Circle((p_right['x'],
                                  p_right['y']),
                                 radius=0.001,
                                 facecolor=(1,0,0,1),
                                 edgecolor=(0,0,0,1),
                                 alpha=1,
                                 zorder=1))
        ax_full.add_line(matplotlib.lines.Line2D(
                xdata=(p_left['x'],p_right['x']),
                ydata=(p_left['y'],p_right['y']),
                linestyle='solid',
                linewidth=0.2,
                color=(1,0,0,0.5),
                zorder=1))
