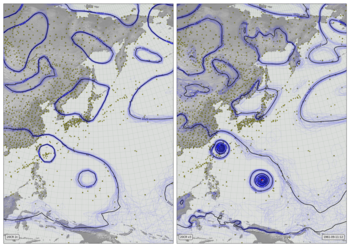
Reanalysis DWR validation scatter+contour plot
Uses this module.
#!/bin/env python

# UK region weather plot
# 20CR2c pressures and validation against DWR

import os
import os.path
import math
import datetime
import calendar
import collections

import matplotlib
from matplotlib.backends.backend_agg import \
                 FigureCanvasAgg as FigureCanvas
from matplotlib.figure import Figure

import IRData.twcr
import IRData.cera20c
import DWR
import DWR_plots

# Get the datetime to plot from commandline arguments
import argparse
parser = argparse.ArgumentParser()
parser.add_argument("--year", help="Year",
                    type=int,required=True)
parser.add_argument("--month", help="Integer month",
                    type=int,required=True)
parser.add_argument("--day", help="Day of month",
                    type=int,required=True)
parser.add_argument("--hour", help="Time of day (0 to 23.99)",
                    type=float,required=True)
parser.add_argument("--opdir", help="Directory for output files",
                    type=str,required=True)
parser.add_argument("--skip", help="names of stations to omit",
                    type=str, action='append',default=[])
parser.add_argument("--video", help="Video frame not still image",
                    action="store_false")
parser.add_argument("--reanalysis", help="20cr2c | 20cr3 | cera",
                    type=str,required=True)
args = parser.parse_args()
if not os.path.isdir(args.opdir):
    os.makedirs(args.opdir)

dte=datetime.datetime(args.year,args.month,args.day,
                      int(args.hour),int(args.hour%1*60))

# HD video size 1920x1080
aspect=16.0/9.0
fig=Figure(figsize=(10.8*aspect,10.8),  # Width, Height (inches)
           dpi=100,
           facecolor=(0.88,0.88,0.88,1),
           edgecolor=None,
           linewidth=0.0,
           frameon=False,
           subplotpars=None,
           tight_layout=None)
canvas=FigureCanvas(fig)
font = {'family' : 'sans-serif',
        'sans-serif' : 'Arial',
        'weight' : 'normal',
        'size'   : 14}
matplotlib.rc('font', **font)

# Get all the DWR stations that appear in the calendar month
obs=DWR.load_observations('prmsl',
                          datetime.datetime(args.year,args.month,1,0),
                          datetime.datetime(args.year,args.month,
                          calendar.monthrange(args.year,args.month)[1],23))
# Remove stations already in ISPD
if len(args.skip)>0:
    obs=obs[~obs['name'].isin(args.skip)]
obs=obs.sort_values(by='latitude',ascending=True)
stations=list(collections.OrderedDict.fromkeys(
                        obs.loc[:,'name']).keys())
latlon={}
for station in stations:
   latlon[station]=DWR.get_station_location(obs,station)

# Get the DWR observations within +- 25 hours
obs=DWR.load_observations('prmsl',
                          dte-datetime.timedelta(hours=25),
                          dte+datetime.timedelta(hours=25))
# Remove stations already in ISPD
if len(args.skip)>0:
    obs=obs[~obs['name'].isin(args.skip)]
# sort them from north to south
obs=obs.sort_values(by='latitude',ascending=True)

# Get the reanalysis pressures and observations
obs_t=None
if args.reanalysis=='20cr2c':
    prmsl=IRData.twcr.load('prmsl',dte,version='2c')
    obs_t=IRData.twcr.load_observations_fortime(dte,version='2c')
elif args.reanalysis=='20cr3':
    prmsl=IRData.twcr.load('prmsl',dte,version='4.5.1')
    obs_t=IRData.twcr.load_observations_fortime(dte,version='4.5.1')
elif args.reanalysis=='cera':
    prmsl=IRData.cera20c.load('prmsl',dte)
else:
    raise Exception("Unsupported reanalysis %s" % args.reanalysis)
prmsl.data=prmsl.data/100  # convert to hPa

n_contours=56
selw=0.1 # Contour line width
scatter_point_size=25
if args.reanalysis=='cera':
    n_contours=10
    selw=0.3
    scatter_point_size=50
DWR_plots.plot_scatter_contour(fig,prmsl,obs_t,obs,dte,
                                 stations=stations,
                                 station_latlon=latlon,
                                 n_contours=n_contours,
                                 contour_width=selw,
                                 scatter_point_size=scatter_point_size,
                                 label_mean_contour=args.video)

# Output as png
fig.savefig('%s/Scatter+contour_%04d%02d%02d%02d%02d.png' %
                                      (args.opdir,args.year,
                                       args.month,args.day,
                                      int(args.hour),
                                      int(args.hour%1*60)))
