SMS PLanet voyage of 1906-7: Route
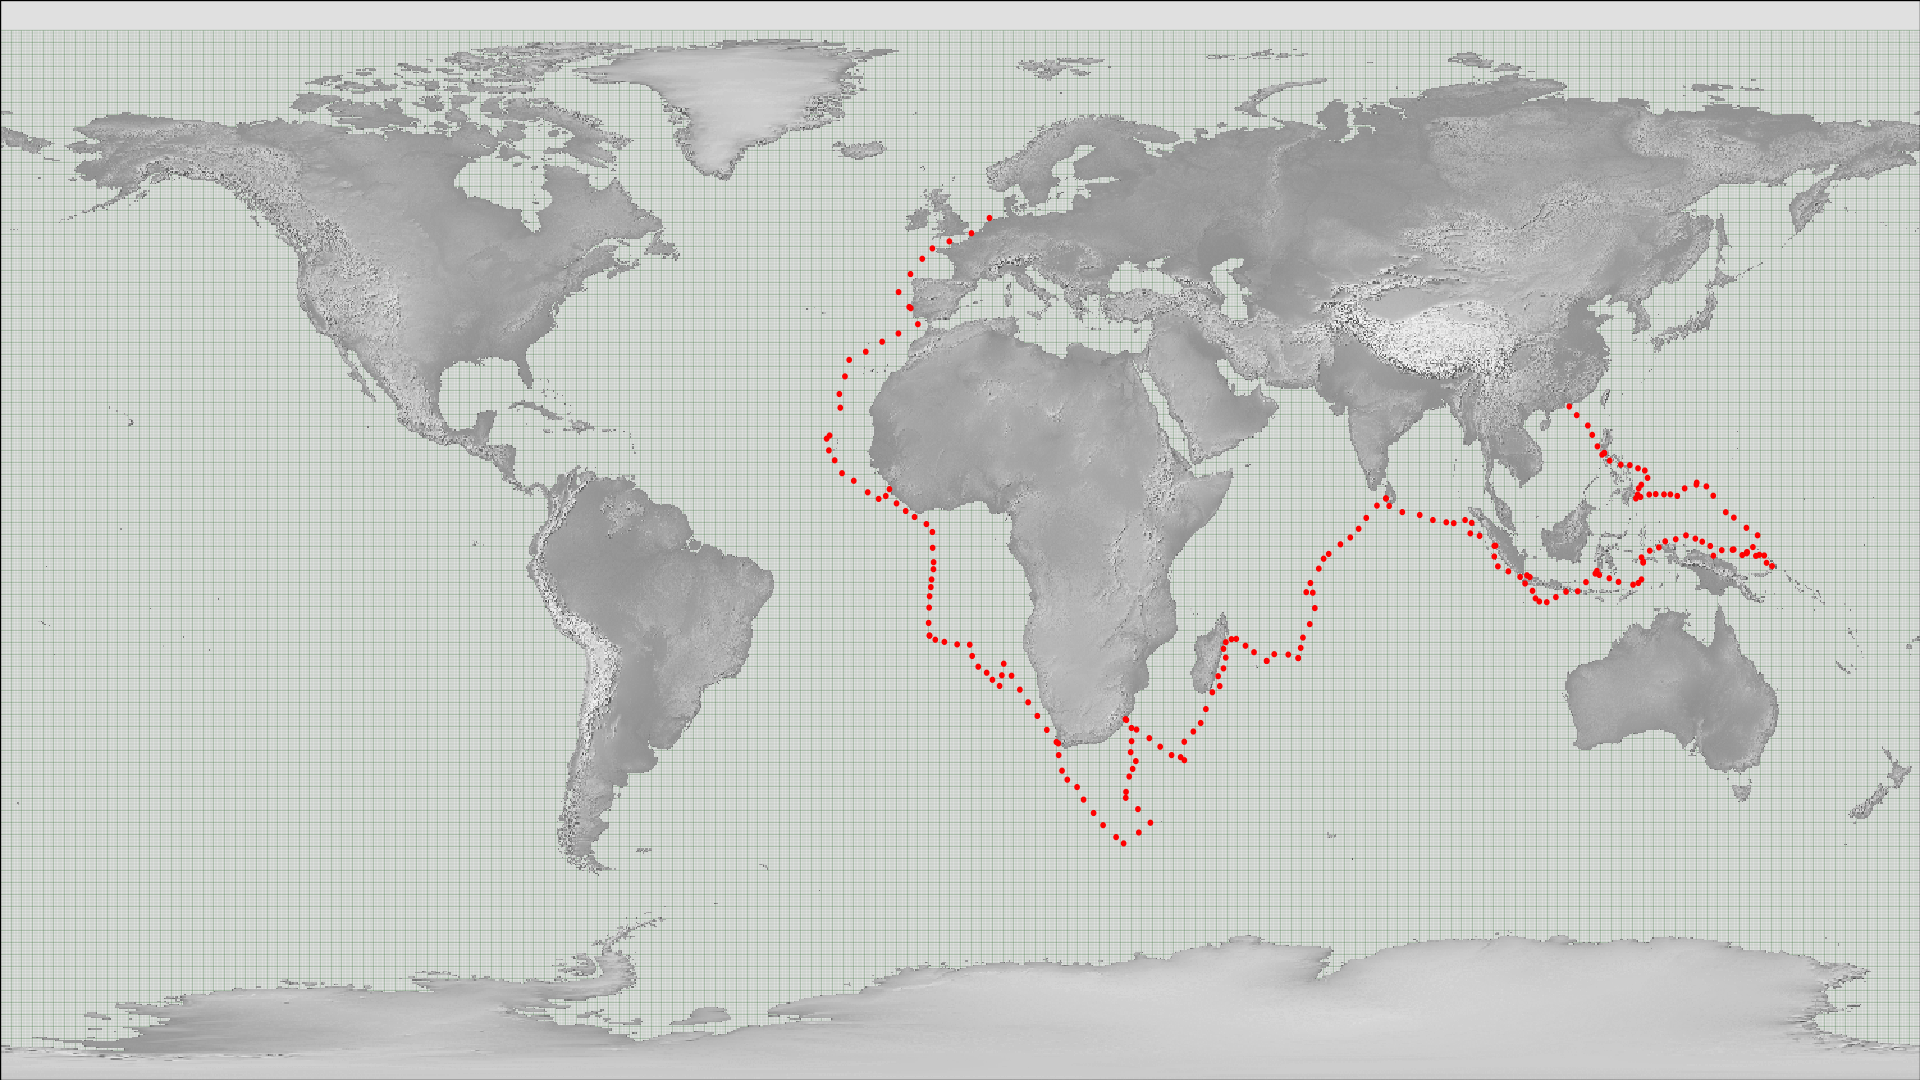
Daily positions of the Planet
Make the figure:
#!/usr/bin/env python

# Show the route of the Planet

import os
import math
import datetime
import numpy
import pandas

import iris
import iris.analysis

import matplotlib
from matplotlib.backends.backend_agg import \
             FigureCanvasAgg as FigureCanvas
from matplotlib.figure import Figure

import cartopy
import cartopy.crs as ccrs

import Meteorographica as mg
import IMMA

# Landscape page
aspect=16.0/9
fig=Figure(figsize=(10.8*aspect,10.8),  # Width, Height (inches)
           dpi=100,
           facecolor=(0.88,0.88,0.88,1),
           edgecolor=None,
           linewidth=0.0,
           frameon=False,
           subplotpars=None,
           tight_layout=None)
canvas=FigureCanvas(fig)

# East-Pacific-centred projection
projection=ccrs.RotatedPole(pole_longitude=180, pole_latitude=90)
extent=[-180,180,-90,90]

# Single plot filling figure
ax=fig.add_axes([0.0,0.0,1.0,1.0],projection=projection)
ax.set_axis_off()
ax.set_extent(extent, crs=projection)
# Fill the figure, don't fix the aspect ratio
matplotlib.rc('image',aspect='auto')

# Background, grid and land
ax.background_patch.set_facecolor((0.88,0.88,0.88,1))
mg.background.add_grid(ax)
land_img=ax.background_img(name='GreyT', resolution='low')

# Add the positions
ob_source=IMMA.get(os.path.join(os.path.dirname(__file__),
                       '../../../../imma/Planet_1906-7.imma'))
for ob in ob_source:
    if ob['LAT'] is None: continue
    if ob['LON'] is None: continue
    if ob['LI'] is not None and ob['LI']==3: continue
    rp=ax.projection.transform_points(ccrs.PlateCarree(),
                                      numpy.array(ob['LON']),
                                      numpy.array(ob['LAT']))
    ax.add_patch(matplotlib.patches.Circle((rp[:,0],rp[:,1]),
                                                radius=0.4,
                                                facecolor='red',
                                                edgecolor='red',
                                                alpha=1.0,
                                                zorder=100))

# Output as png
fig.savefig('Planet_route_map.png')